

Using Digital Tools to Understand New Excavation Areas
Catherine Scott
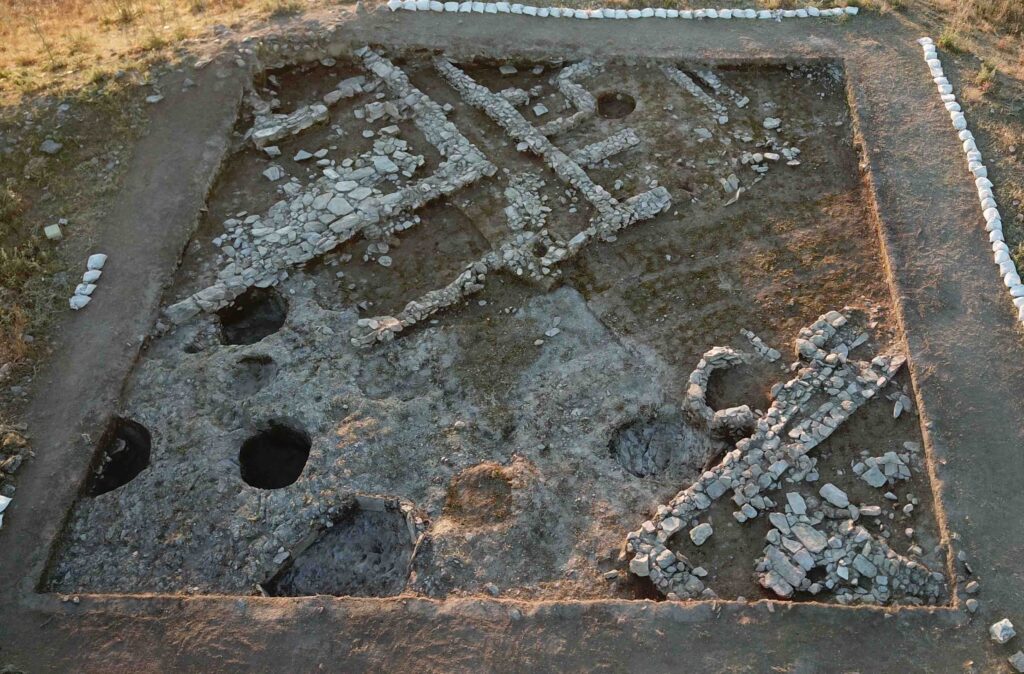
Excavation area 97.541 is a good example of the potential history of an excavation area at Kaymakçı. It was first excavated in 2015 by Emily Wilson, then continued in 2016 by Haley Chasteene. Emily returned for the study season in 2017 to reassess the area in advance of our recent summary publication. Now I will be excavating this area again in 2019.
The extensive digital documentation that results from our workflow at Kaymakçı facilitates the transfer of an excavation area from one area supervisor to another, as well as research during the off-season or during study seasons.
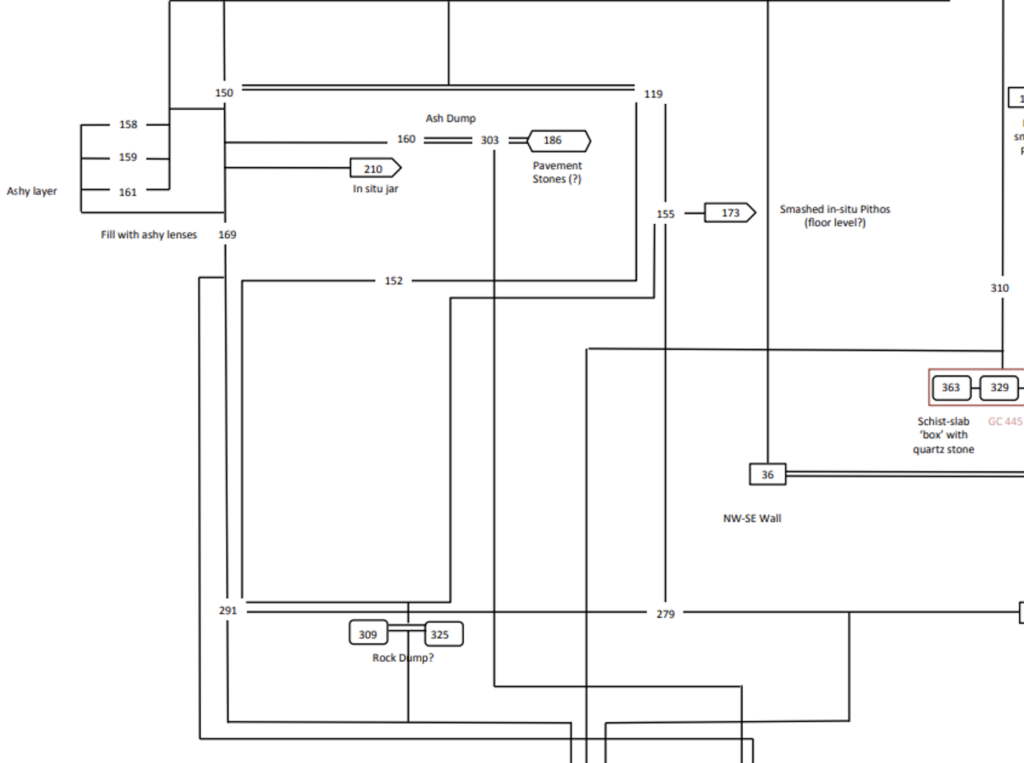
An excavator or researcher will generally start with the available reports; at Kaymakçı, we write regular interim and final reports that include both a narrative of what occurred during the season and the excavator’s interpretations. The report also includes a Harris matrix, a form of representation very common to archaeologists that helps visualize stratigraphic sequences (or, the physical relationships between deposits and features).
We also create other forms of digital documentation that are extremely helpful in understanding the work that has been done to date.
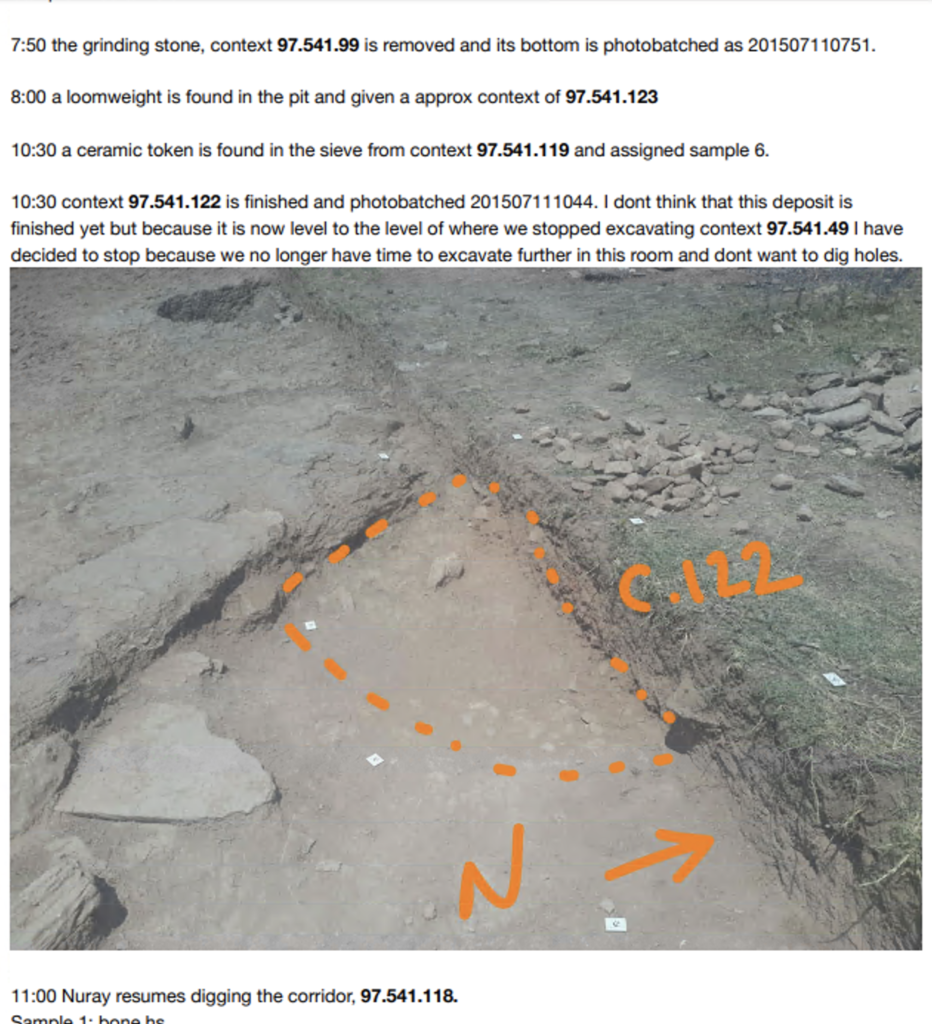
Excavation journals are written in Evernote and archived on the project data server; excavators can easily take pictures and annotate them to explain how they are excavating or to highlight features of interest.
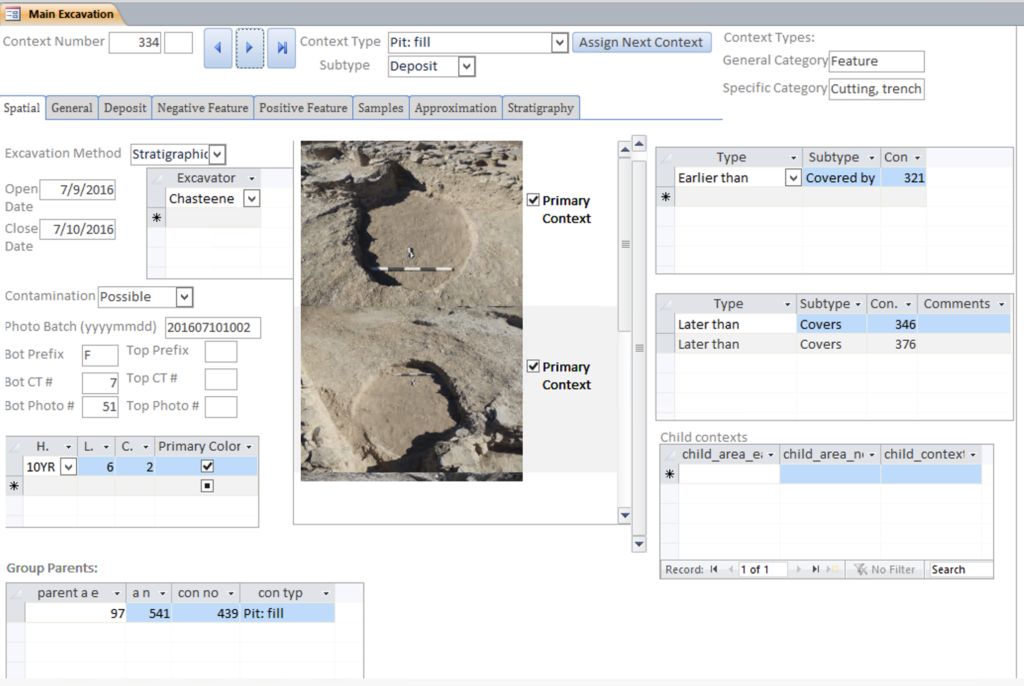
Our networked project database allows for easy access to data on contexts and samples. It pulls together information from all participants, including excavators and specialists.
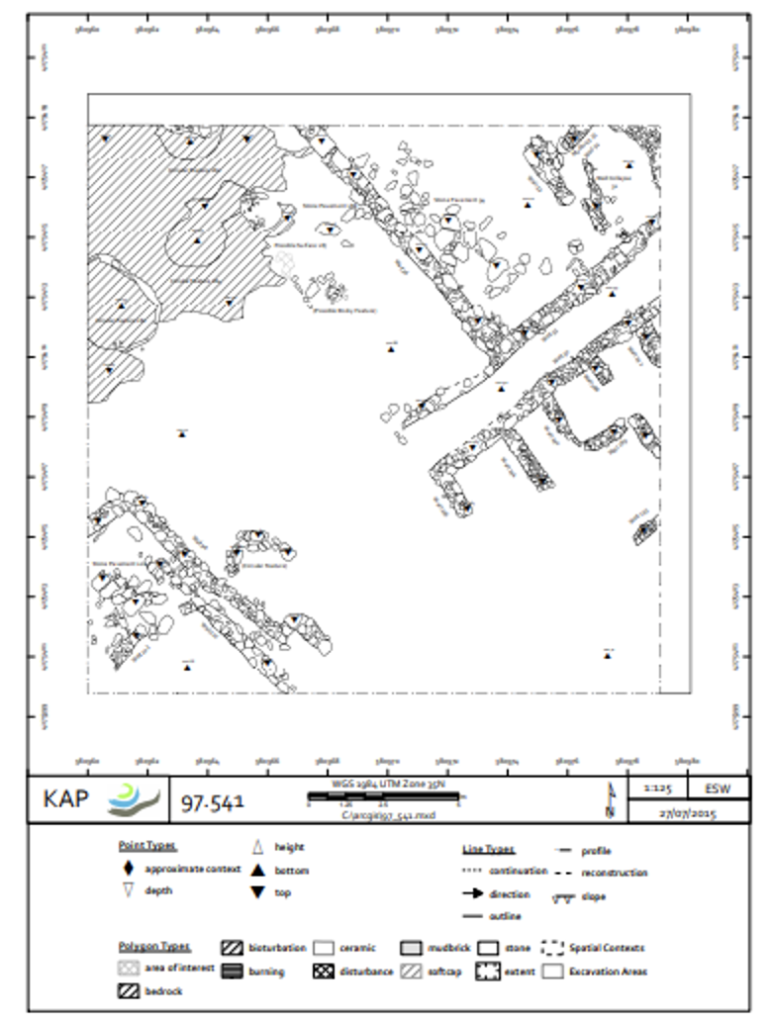
Spatial data recorded in ESRI’s ArcMap (a Geographic Information System, or GIS) are also easily available. We archive all files from previous years, so researchers can access plans from each day of excavation to see how they were recorded by the excavator at the time. These “day plans” show the state of the excavation area at the end of each day.
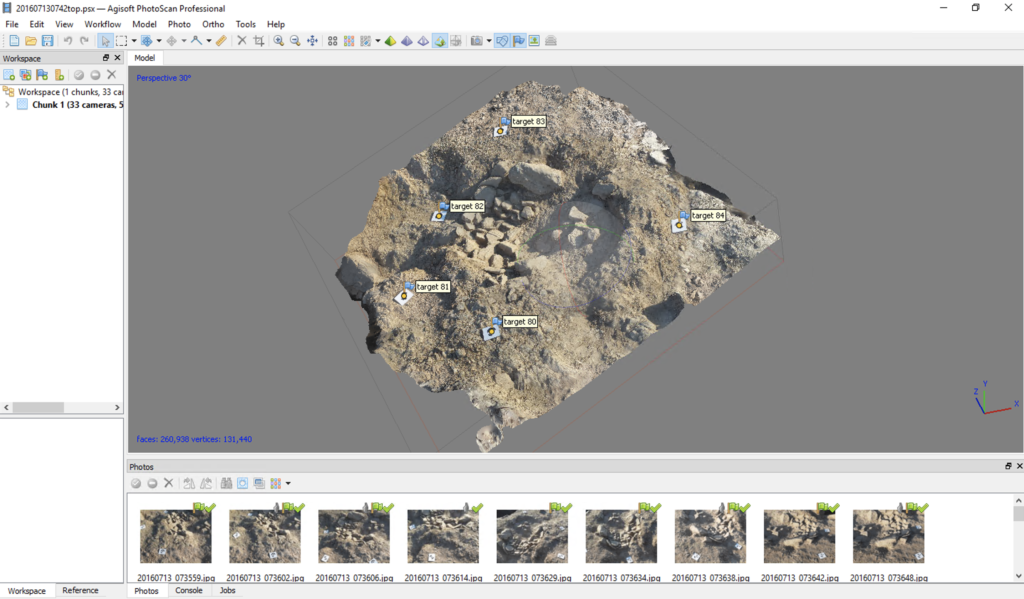
We also have access to the 3D models produced for every context, which provide all the spatial data from the excavations. Because these models are detailed and dynamic, they can often provide much more clarity than traditional photographs. These models help us to “relive” the excavation, in a way, by allowing us to see what each context looked like before and after it was removed, in all of its three-dimensional complexity. We also continue to develop 3D volumes of each context using these models, which allow us to virtually reconstruct and re-excavate each area in different ways.
All these resources are available via our networked data server, and therefore directly on each area supervisor’s computer via a remote desktop connection. With all these tools at our disposal, we are able to get up to speed quickly on previously unfamiliar excavation areas!
Look forward to more posts from Gygaia Projects over the course of the year!